
Table of Contents
Introduction to 509's
Locating and Generating Individual 509 Reports
The Basics
Academic Calendar
First Year Class
Applications and Enrollment
Test Scores and Grades
Curricular Offerings
Faculty Resources
J.D Enrollment
J.D Degrees Awarded
1L Tuition and Fees
Living Expenses
Grants and Scholarships
Conditional Scholarships
Academic Attrition
Other Attrition
Transfers
Generating Macro-Level Data
Conclusion
Introduction to 509 Reports
What is a 509 Report? In the wake of the financial crisis there was a movement towards increased transparency in legal education. Current students and graduates accused schools of being misleading in their reporting of entrance statistics, employment results, and bar passage outcomes. As a result the American Bar Association (ABA) began mandating certain disclosures be made available to the public from each accredited law school. This guide will focus specifically on the Standard 509 Information Report, or as it is more commonly known, 509’s. 509’s generally detail the “input” side of law school reporting. They focus on things like LSAT and GPA scores, demographics, etc. They do include some school specific information however, such as clinical offerings, transfers and more.
Each year the ABA provides guidance to law schools regarding how they should format their reports, what information should be included, and any relevant changes from prior year reporting. Schools compile their data and submit it to the ABA by a mid-October deadline. The ABA then compiles the data and makes it available for public view in mid to late December.
This report is designed to help you understand the broad array of information presented in a 509. We polled the consultants working here at Spivey Consulting, who have a broad array of experience with law school admissions and will also include tips and comments from them where it may be helpful.
If you're interested in a specific term on the 509, simply search that term in this document- we've stuck to using 509 terminology for that exact reason.
And when you're reading this please remember these are numbers schools report without much context. As our own Danielle Early puts it, "take the data and ask the school what it means rather than assume you know". Do your research; look at websites, talk to students and schools. Context is key.
Locating and Generating Individual 509 Reports
The ABA compiles the 509 reports on the following website: http://www.abarequireddisclosures.org/Disclosure509.aspx
Annual reports are available from 2011 onward, in generally similar formats each year. There are two options to choose from when viewing a 509 report. The first is an individual school and year specific report.
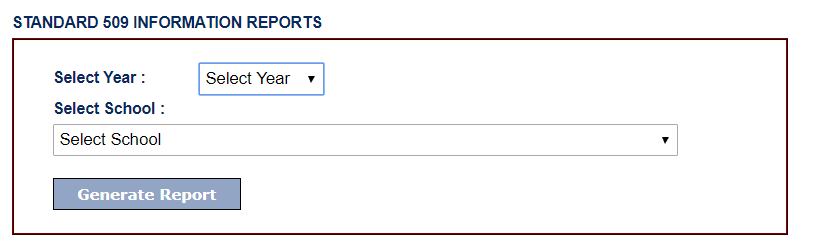
In this tab you can first choose the year you’re interested in. Generally applicants are most interested in the most recent year of reporting. For example, if you are applying in the 2019-2020 cycle you’d likely be most concerned about the 2019 509 reports, as they include the most recent data for schools. However if you want to see prior year data the reports go back to 2011!
In the second tab you can choose the specific school you are interested in. Every ABA accredited school is included. The selected options would look like this:
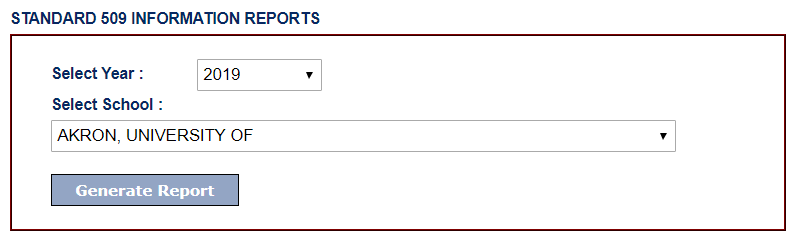
To see the 509, click "Generate Report". Depending on which browser you use and your setting, one of several options will pop up asking you if you want to open the link/download the file etc. Click yes- the ABA isn't trying to hack your computer.
A new page or file will appear which will include the entire ABA 509 disclosure for that school from the year you selected. Congrats, you've generated a 509 report!
Pulling the 509 is one thing. Understanding it is another. How do you interpret all the numbers and labels? We're going to go through each section of the 509 report, explaining terms, giving context to numbers, and highlighting important areas when they appear. We'll be working with the ABA's generic 2019 509 template, which can be located here.
Lets start with the "title" area for each individual 509.

The Basics
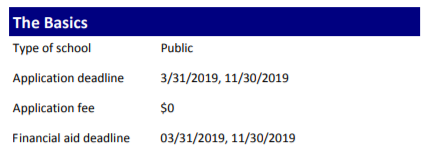
Aptly named, “The Basics” will help you understand high level information about the school., their applications, etc.
There are two "Types of School"- Public or Private. Public schools are those that receive public support- generally local or state level. Private institutions do not have a formal relationship with a government organization. Public institutions generally offer lower tuition to in state applicants.
Application Deadlines can be difficult to understand if, like our example, there are more than one. If you do see more than one deadline it’s safe to assume the school has some kind of “early decision” “early application” “priority deadline” etc program, or that the school admits students for Spring/Summer start terms. We recommend checking on the school website directly for a more comprehensive understanding of what those dates mean. A schools LSAC application will also generally have this information.
The “Application Fee” is the school-specific dollar amount you will be charged to apply to the program. It generally ranges from $0 (no school specific fee) to around $100. Many schools will offer application fee waivers to candidates who have signed up for LSAC’s Candidate Referral Service, have a financial hardship and have received an LSAC fee waiver, or attend a school tour, visit their table at a LSAC school fair, or other such event. Please note that this application fee does not include the LSAC CAS fee to apply to a school, which is an additional $45 per school unless you have received an LSAC fee waiver.
The Financial Aid Deadline again refers to when applicants are expected to submit their FAFSA and supporting documents if they wish to receive need-based financial assistance.
Tips on Reading This Section
Frankly, 509 reports aren't the best source of information for these categories. We suggest reviewing the schools specific LSAC application, their website, or just asking an admissions officer if you have questions.
Academic Calendar
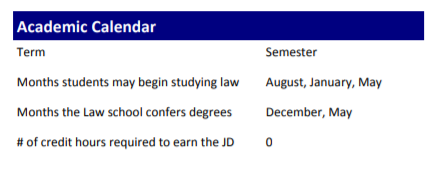
The Academic Calendar describes the “schedule” of student life at this institution.
Term will describe if this school operates on a Semester schedule, as most schools do, or a variation such as Trimester, Quarters, etc.
The Calendar will also list when students may start- Months Students May Begin Studying Law. A July-September start is usually associated with the “traditional” fall start. Other dates will indicate if the school offers a Spring, Summer, or Winter start term. We advise checking school websites for more information on those specific programs.
It will also describe which months the school confers degrees to its graduates, the Months the Law School Confers Degrees.
And finally, this section will list the Number of Credit Hours Required to Earn the JD. Generally this isn’t something you should be focusing on, as it’s very difficult to compare this number across programs.
First Year Class
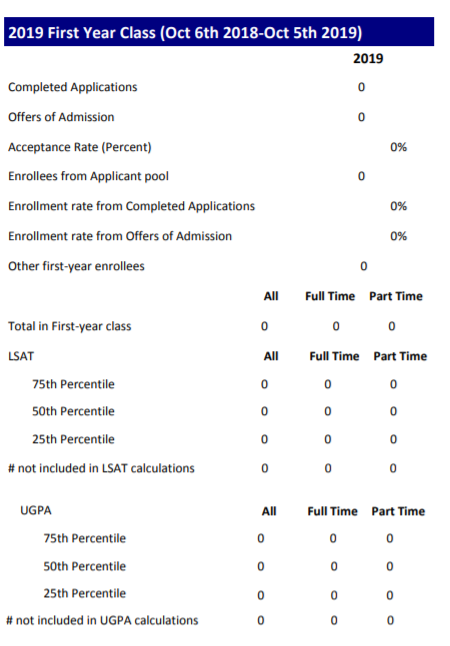
The largest category on the 509 by far. It covers the 2019 first year class- or, the first year class of whichever year you chose to generate a report for. This is where you’ll see most admissions related data.
Applications and Enrollment
Completed Applications is simply the number of applications to this law school that were submitted and complete. A higher number of applications does not necessarily mean the program is more competitive, and a lower number doesn’t necessarily mean it is less. There are many factors- location, ranking, class size- that can go into the number of applications a school receives.
Offers of Admission details exactly how many offers of enrollment were made by the school. It includes early decision, regular decision, waitlist acceptance, etc- any confirmed offer of admission is counted. Acceptance Rate (%) builds off this. It is the percent of applicants who are offered admission. A lower percent means fewer people get in; a higher percent means more. Acceptance rate is a factor in the USNWR rankings, where lower rates are considered to be better.
Enrollees from Applicant pool counts the raw number of applicants from that year who matriculated to the school. This number is used to generate the Enrollment Rate from Completed Applications, which is the percent of applicants who choose to enroll.
It also generates the Enrollment Rate from Offers of Admission, commonly referred to as “yield”. This is the percent of applicants who received an offer of admission that choose to matriculate at that law school. Schools generally aim to have higher yield. After all, what's the point of admitting you if they think you won't attend? This is why it can be helpful to find ways- visiting, optional essays, etc- of demonstrating your specific interest at a school.
Other First Year Enrollees isn't particularly relevant to applicants. It is generally the number of prior-year deferred admitted students who start that year, transfers with less than one year of law school credit, or students previously withdrawn or suspended with less than one year of law school credit who resumed their studies.
Total in First Year Class is the number of students who matriculated that term- essentially, the first year class size. It's divided into categories. If a school has only a full time program, they'll only report the Full Time and All numbers. If a school has a part time program, they will report the number of matriculates to the Part Time program, and add that number to the Full Time for the number of All matriculates.
Test Scores and Grades
Ok this is what you really care about, we know. Test scores and grades are generally considered to be important predictors of a given applicants chance of admission at a law school. They're not the only factors, but they're certainly important.
Each category in both LSAT and GPA is broken down into the numbers for Full Time and Part Time programs- as well as the cumulative number. You, as an applicant, should be most focused on the numbers for the program you are applying to. If that's full time, focus on full time. If it's part time, check the part time numbers.
Both the LSAT and GPA numbers are for matriculates to the program. It does not represent the scores of all those admitted; only those who chose to begin their studies in the relevant year.
LSAT has three numbers associated with it: 75th, 50th, and 25th. Each of these LSAT numbers refers to the matriculates highest LSAT score- if a matriculate took the LSAT more than once, only their high score is considered when creating these percentiles.
The 75th LSAT is the raw LSAT score, on the 120-180 scale, at which 75% of the class is at or below. So at a school with an LSAT 75th of 156, 75% of first year matriculates would be at or below a high LSAT score of 156.
The 50th LSAT is the raw LSAT score, on the 120-180 scale, at which 50% of the class is at or below. It is commonly referred to as the "median LSAT". The median LSAT holds special significance in admissions because it is the LSAT score used in the US News and World Report rankings of law schools. Schools are strongly incentivized to maintain or increase their LSAT medians.
The 25th LSAT is the raw LSAT score, on the 120-180 scale, at which 25% of the class is at or below.
Number Not Included in LSAT Calculations is the sum total of matriculates who did not have an LSAT score. There are a number of ways to be admitted to law school without an LSAT. The ABA allows law schools to matriculate certain applicants who meet GPA and SAT/ACT requirements; many schools do this. It also includes applicants who were admitted with an alternative test, such as the GRE, which is gaining broader acceptance at US law programs. If you are applying with a GRE, it may be helpful to evaluate the changes in the number not included in LSAT calculations at schools you are interested in. In particular, we suggest checking how that number has changed since the school began accepting GRE candidates (you will need to pull prior year 509 reports to evaluate that).
UGPA refers to the LSAC calculated Undergraduate Grade Point Average for matriculates to the law school. All applicants to US law schools must submit all coursework completed, before and after their bachelors was awarded. The Law School Admission Council (LSAC) re-calculates applicant GPA's to generate a standardized GPA. You can read more about that process here.
75th UGPA is the LSAC calculated GPA at which 75% of matriculates are at or below. So at a school with an UGPA 75th of 3.56, 75% of matriculates had an UGPA of at or below 3.56.
50th UGPA is the LSAC calculated UGPA at which 50% of matriculates are at or below. It is commonly referred to as the "median GPA". Like the median LSAT, US News and World Report uses the median UGPA as a factor in their law school rankings- though it is somewhat less heavily weighted than median LSAT. Because of this, there is a strong incentive for law schools to improve their median UGPA.
25th UGPA is the LSAC calculated GPA at which 50% of matriculates are at or below.
The Number Not Included in UGPA Calculations includes those applicants who did not have an Undergraduate GPA that could be calculated by LSAC- most commonly international matriculates.
Tips for Interpreting This Section
Anna Dutia suggested looking at a schools GPA and LSAT stats curve, saying applicants should ask "is it pretty narrow and symmetrical or is one particular tail long and flat?" Why? Because "that may give us an idea of how much softs may matter and for which metric." I.e., is a school more forgiving of a relatively low LSAT, or of a low GPA? Joe Pollak agrees, pointing out that certain schools have a much wider spread between their medians and 25th percentile scores. This can help splitters (those above one median and below the other) get a better assessment of their chances. A wider spread tends to indicate a school is more accepting of splitters.
Speaking of stats, it might be helpful to review a schools academic credentials over the past couple years. Medians, 25ths, 75ths change from year to year- particularly GPA- so establishing a historical context for those numbers can be helpful to understand where you would sit historically at that school, with an understanding that the most recent years are the most important. If those numbers are going up, it can indicate the school is becoming more competitive. Going down may show the school is less selective about the academic credentials of those it admits than in the past.
Tom Robinson points out that international applicants should pay careful attention to the number enrolling without a reportable GPA, saying "if you attended an undergrad outside of the U.S. or Canada, you’re likely going to have a non-reportable GPA. How many students does the school enroll each year with non-reportable GPAs. This may partially inform whether a school is a safety or reach."
Joe Pollak has another great point about applications and yield- they're subject to a lot of self-selection. For example, Yale receives fewer applications than many other elite law schools, but still has a lower acceptance rate, meaning many students are already self-selecting out of Yale believing they don't have a chance. This applies to schools across the spectrum- applicants are aware that schools tend to look for a certain profile, and may self-select out of applying at schools they don't think they have a chance at. But remember- you'll never get in if you don't apply. The worst they can do is say no.
Curricular Offerings

This section can be helpful to you as you consider whether a school has plentiful experiential opportunities for you during your education, or if you're interested in learning about class sizes.
Typical First Year Section Size counts the normal size of a first year core curriculum class. Most US law schools split their incoming first year classes into what are called "sections". You'll generally take most of your first year classes- Criminal Law, Constitutional Law, Torts etc- with that section. This number will be helpful in telling you how many people you'll be sharing those first year courses with.
Number of Course Titles Beyond The First Year Curricular Offered Last Year is the sum total of "elective" course titles a law school offered in the prior academic year. It may be helpful in gauging the breadth of academic offerings a school has; though of course, larger schools will typically have higher raw totals than smaller schools. We recommend checking school websites or speaking to current students, admissions departments, etc in order to get a more comprehensive view on what the available courses are. Please also note that if a course is offered twice with the same title it only counts once- so for example, "European Union Law" offered in both the fall and spring semesters would only be counted once.
Number of Upper Division Class Room Course Sections With an Enrollment of...refers to the sum total of "elective" course offerings with an enrollment count in a given range, listed here:
Under 25- less than 25 students were enrolled in the course
25-49- the course had between 25 and 49 students enrolled
50-74- the course had between 50 and 74 students enrolled
75-99- the course had between 75 and 79 students enrolled
100+- the course had over 100 students enrolled
Number of Seats Available in Law Clinics Last Year counts the total number of seats in clinics organized by the law school in the prior academic year. Law school clinics are hands on experiential programs where students work under the supervision of licensed attorneys to engage in legal work. They can be as diverse as as immigration advocacy, criminal defense, business law, or any number of other opportunities. If you are looking for a school with experiential opportunities, this may be helpful quantifying the number of those opportunities. However, we once again urge prospective matriculates to always check school websites or speak with students and admissions offices for a fuller understanding than just numbers on a report.
Number of Field Placement Positions Filled Last Year is the sum total of positions held by law school students at work sites such as: judges chambers, public defender offices, government agencies, NGO groups, etc. Experiences such as an externship with the Department of Justice would be counted here. This number can be difficult to judge without knowing the number of students who applied for such positions. However, a higher ratio of placement positions filled to upper level students (second and third years) may offer a reasonable indicator that the school has strong field placement power.
Number of Seats Available in Simulation Courses is the sum total of class spots available in courses at that school that involve simulated legal work- such as Merger & Acquisition simulations, Arbitration simulation, etc. Georgetown University Law Center has a good example list of simulation courses here. Please note that this is only the sum total of seats available; it does not reflect the number of seats in a particular simulation course.
Number of Seminars is simply the sum total of seminar classes offered by the law school in the prior academic year. Seminars tend to be smaller than traditional "lecture" courses, and usually have a thematic focus such as Ethics and Law. Seminars also tend to be more writing intensive than traditional lecture courses.
Number of co-Curricular Offerings counts the number of extra-curricular programs sponsored or supported by the law school. This can include programs such as law journals, moot court, etc. If you review national level data it's clear that schools count this metric in different ways- with some schools reporting as few as 0 such offerings and others offering as many as 100+. This is a metric we suggest ignoring; applicants should instead review material on each schools website or published material for a sense of co-curricular opportunities.
Tips on Reading This Section
So much of the information here is presented without any context. Check school websites and speak to current students for information about programs or offerings you're specifically interested in!
Faculty Resources

In this section schools report on their faculty, which is obviously an important consideration for students. After all, you're presumably paying a great deal of money to attend the school- you'd like to have sufficient faculty for a quality education.
First are the number of law school faculty members, broken down into the Full-Time, non-Full time, and Total categories. The ABA recognizes that prospective students are interested in the gender and ethnic background of their potential faculty, and provide the number of Male, Female, and Other faculty members for each category. Additionally, the number of Minority faculty are reported, though only as a sum total of each category; the Minority faculty data is not further broken down into each gender category. The Total for each category of faculty is also provided.
Full-Time Faculty Members are, as defined by the ABA, "an individual whose primary professional employment is with the law school, who is designated by the law school as a full-time faculty member, who devotes substantially all working time during the academic year to [teaching]".
Non-Full Time Faculty Members are those with teaching responsibilities that are not working full time or primarily for the purpose of legal education.
The Total is simply the sum of Full-Time and non-Full Time faculty.
Be careful not to read too much into these numbers. While more faculty may indicate a broader array of course offerings, larger schools will by necessity have more total faculty. We'd suggest reviewing the ratio of student:faculty, as well as a list of course offerings at each school you're considering, to keep these numbers in context.
Additionally, the Faculty Resources category includes a count of other staff at a law school who will be important to your education.
Librarians are those working in the school library who are "doing work that requires professional education (a J.D. degree or a master’s degree in library or information science, or the equivalent)" per ABA guidance.
Administrators "include those with the rank of Associate Dean, Assistant Dean, or Director" also per ABA guidance.
Both the Librarians and Administrators are broken down into the Full-Time and Part-Time counts.
J.D Enrollment

Want to know about the racial and gender demographics on your future classmates? This is where to look. As you can see the ABA has adopted a table view approach to presenting this information, breaking it down into component categories and sub-categories for ease of information.
First, the ABA lists different racial categories that students self-reported at the time of their application.

7 of these are distinct racial categories- Hispanics of any race, American Indian or Alaska Native, Asian, Black or African American, Native Hawaiin or Other Pacific Islander, and Two or More Races, and White. Definitions for these terms are below and quoted directly from ABA guidance:
Hispanics of any race: A person of Cuban, Mexican, Puerto Rican, South or Central American or other Spanish culture or origin, regardless of race.
American Indian or Alaska Native: A person having origins in any of the original peoples of North America and who maintains cultural identification through tribal affiliation or community recognition.
Asian: A person having origins in any of the original peoples of the Far East, Southeast Asia, or the Indian Subcontinent, including, for example, Cambodia, China, India, Japan, Korea, Malaysia, Pakistan, the Philippine Islands, Thailand, and Vietnam.
Black or African American: A person having origins in any of the black racial groups of Africa.
Native Hawaiian or Other Pacific Islander: A person having origins in any of the original peoples of Hawaii, Guam, Samoa, or other Pacific Islands.
Two or more races: The category used to report a non-Hispanic person who selects two or more of the other racial categories.
White: A person having origins in any of the original peoples of Europe, the Middle East, or North Africa.
The Total Minority category is the sum of each of the following: Hispanics of any race, American Indian or Alaska Native, Asian, Black or African American, Native Hawaiin or Other Pacific Islander, and Two or More Races.
Nonresident Alien is defined as "a person who is not a citizen or national of the United States and who is in this country on a visa or temporary basis and does not have the right to remain indefinitely".
Race and Ethnicity Unknown is a catch-all for those individuals whose racial and ethnic background are unknown to the law school.
The Total is simply the sum total of the above categories.
Next, the table is broken down by class year and total.

JD1 refers to students in their first year, JD2 to students in their second year, JD3 to students in their third year, and JD4 to those in their fourth year (included only for those schools reporting fourth year students). The Total is the sum total of students across all class years.
Within each class year the racial and ethnicity counts are further broken down by gender reporting.

M is the total number of students in that class year identifying as men belonging to that racial or ethnic background.
W is the total number of students in that class year identifying as women belonging to that racial or ethnic background.
O is the total number of students in that class year identifying as neither men nor women belonging to that racial or ethnic background.
T is the total number of students in that class year in all gender categories belonging to that racial or ethnic background.
Using this information we can read a sample J.D enrollment table from Harvard Law's 2019 ABA report.

Find the racial and ethnic background category you are interested in, and the sub-category you want to know more about- then find that box in the table. For example, if you wanted to know the number of first year students who identified as Hispanics of any race, you would look at that row, and the "T" column under the JD1 tab and see there were 55 such students.
Tips on Reading This Section
Many applicants are understandably interested in knowing the demographic makeup of their potential classmates, or seeking out a school that they believe will feel more inclusive and welcoming. This is the best place to do that- and we suggest focusing less on raw numbers than percentages. We also believe that it's better to look at total numbers, instead of JD1, JD2, JD3 etc, particularly in small schools. Minority matriculates are a small number, and small numbers can be subject to random one year variations. The three year data should give a more representative idea of the makeup of the school. Of course, if a school says they've made an effort to increase minority enrollment in recent years, looking at the one year data over time can be helpful in determining how successful they've been.
This section can also be helpful to international applicants. Tom Robinson says he "would be checking to see what the 1L non-resident alien pool looks like" to see if they typically have a large or small group- some schools admit and enroll very few applicants (remember- 509 data will only show matriculants for international students, not applicants).
J.D. Degrees Awarded

This category is fairly straightforward. It breaks down the total number of individuals awarded a J.D. degree in a given year (here in the 2018-2019 academic year) by each racial category, as defined in the "J.D. Enrollment" section.
1L Tuition and Fees

This section of the 509 report will list out applicable non-discounted costs for tuition, fees, etc- i.e. educational expenses.
Please note that law school tuition generally increases between one and five percent annually, and so to determine what you would pay if you enrolled it's important to check the schools website where they will generally list upcoming year tuition and fees. If they do not, anticipate that it will likely increase at least two percent from the prior year.
This category is broken down in two ways: Per Semester and Per Credit. If a school does not operate on a traditional "Per Semester" schedule then that category will be replaced with the applicable term- quarter, trimester, etc.
Per Semester is generally what is applicable to those students who are attending the school on a full-time basis, or a part time program with a dedicated schedule. It is the non-discounted sum total a student will be charged for a full courseload in that period.
Per Credit is simply the dollar amount paid per credit-hour at a school. A class with 3 credit-hours will be three times the dollar amount per credit hour. This is primarily applicable to those attending a part time program without a designed courseload, or those taking extra classes.
For full time and part time students to calculate the annual cost multiply the Per Semester/Quarter/Trimester etc number by the number of such periods a full time student takes during the year. I.e., under a Semester schedule multiply the Per Semester Tuition and Fees.
The Per Semester and Per Credit categories are also broken down further. First the schools report "Tuition" which is the amount charged to each student for class enrollment. "Fees" are mandatory fees charged to all students at the law school other than tuition. Fees do not include cost of living.
Each category is also broken down into Resident vs. Non-Resident rates. This will generally only be applicable to programs at state-sponsored schools. Almost always these state sponsored schools will offer a lower tuition rate for state-residents than non-residents. Here's an example:

As you can see non-Residents are charged about $4,000 more for full time tuition; $2,000 more for part time attendance. If you are considering attending a state-school as a non-resident it may be useful to check their policies on establishing residency, as doing so at some point can save a substantial amount of money.
The Tuition Guarantee Program is a binary Yes/No option. A Tuition Guarantee Program means that the law school guarantees matriculates that their tuition will be frozen at the amount it was when they entered for the duration of their attendance. If a school does not have such a program you should assume regular tuition increases each year.
Living Expenses

The vast majority of law students will not be earning an income sufficient to cover their lifestyle- housing, food, medical care, transportation, etc. Nor will they be able to rely on family or spouses, at least not entirely. That's where the estimated Living Expenses come into play. Each school calculates what it feels is a reasonable annual expenditure for a given single student to live in each of the three above categories:
Living on Campus are those who live in school-sponsored campus housing.
Living off Campus are those who sought private housing arrangements.
Living at Home are those who live with their parents or other family.
These breakdowns are by housing arrangement because that's typically the largest source of living expense for a given student. However, it also does include aforementioned considerations- food, transportation, insurance, entertainment etc.
Tips on Reading This Section
We suggest not relying solely on these numbers when estimating your budget. There is no set formula schools are required to follow when estimating this number, and each financial aid office operates under different considerations. Some can be very conservative, some very generous. And your particular situation might be different from other applicants. Shannon Davis says "I recommend students have a frank conversation with the financial aid offices to get more accurate numbers for their own situations."
There are a few things other things you can do to get a better sense of potential cost of living at a given school. Check their website to determine how they arrived at their numbers- most schools will post a rough outline of their methods and sub-costs. You can look at Cragslist, Zillow, etc to get a sense of how expensive certain types of housing are in the area. There are publications that detail cost of living in different geographic areas. And if you're comfortable with it, current students can help give you a sense of whether they felt like the schools estimated budget was reasonable.
Cost of Living estimates by schools are important if you plan to take out federal loans to finance your cost of living while in school. The amount of these loans you can take out is generally limited by what the school estimates cost of living is. I.e., if a school estimates their cost of living at $25,000 per year the federal government will not loan you $33,000 because you anticipate needing more than the schools estimate (with certain limited exceptions).
Grants and Scholarships

With about 3 out of 4 law school students receiving financial aid of some type, paying the advertised "sticker" price for law school is becoming less and less common. This is a great section to refer to when evaluating any scholarship offer you've received from a school, as well as a good guide for potentially negotiating with a school. Please note that this is the cumulative number of scholarships for all students at the school- it is not specific to a given year. A rough estimation of the per-year number of each scholarship would simply be dividing the total by three, though this is not always the case.
Most law school scholarships- the vast majority- are merit based aid awarded based primarily on your academic credentials; GPA and LSAT (or other standardized test). Why is that? Well, remember that law school rankings draw heavily from a schools median GPA and test scores. This gives schools a strong incentive to try and make those numbers as high as possible. Schools also generally see those as being somewhat predictive of academic success during law school. So, schools use scholarships to entice candidates that will help their median scores, as well as succeed academically. This means most of your negotiating power for scholarships comes from your combination of GPA and test scores.
Schools may also offer need-based aid. This number will generally be determined by the schools specific need calculations and your FAFSA submission. Need-based aid is generally not negotiable. Any need based aid included in this chart will be grant aid- need based loans are not included.
Many schools also have specific programmatic or named scholarships. These are generally endowed for a specific purpose. Examples can include public interest scholarships, scholarships for candidates with certain racial or ethnic backgrounds, scholarships for students pursuing a career in teaching, etc. Candidates may or may not need to apply for these specifically. We suggest checking each schools website to see what kind of specific programmatic or named scholarships they may have.
Each of the above types of scholarships are included in the table reported on a schools 509. While they are not broken down into their sub-types, it's safe to assume at most schools that they are primarily merit-based scholarships.
The "#" and "%" signs here

refer to the raw total number, and the percent of total being offered that amount. The ABA knows lawyers tend not to love math and so helpfully did the percentage of total calculations for you in each category.
The table is broken down into several rows.

Each of these identifies the students receiving a certain amount of aid.
Total Number of Students is the sum total of students attending the school in the given year. It is used to determine ratios of students receiving scholarships in other categories.
Total Number Receiving Grants is the number students attending the school who received some form of grant scholarship assistance.
Less than 1/2 tuition refers to those students who are receiving less than half the total tuition cost in grant aid or scholarships.
Half to Full Tuition refers to those students who are receiving half to full total tuition cost in grant aid or scholarships.
Full Tuition refers to those students who are receiving 100% tuition cost in grant aid or scholarships. These students are not paying for tuition.
More than Full Tuition refers to those students who are receiving a full tuition scholarship, and an additional stipend that can be applied to cost of living.
75th Percentile Grant Amount is the dollar amount, among scholarship recipients, that 75% of recipients are at or below.
50th Percentile Grant Amount is the dollar amount, among scholarship recipients, that half of recipients are at or below.
25th Percentile Grant Amount is the dollar amount, among scholarship recipients, that 25%of recipients are at or below.
The ABA breaks down the different scholarship categories above into their Full Time, Part Time, and Total amounts.

This can be very helpful to check. For example, if applying to a Part Time program, we would suggest checking the percent of scholarships offered at each level relative to full time counterparts to determine if a school is likely to offer you comparable financial aid.
Simply find the relevant scholarship category row, and check the full time or part time program to see the data. Take a look at the example 509 below.

Suppose you wanted to know the percent of full-time students at this school were offered half to full tuition scholarships. You'd check the "Half to Full Tuition" row, and then go to the "Full Time" Column under the % sign and see that 30% of students at this school received Half to Full Tuition scholarships.
Tips on Reading This Section
These numbers can be particularly helpful to those attempting to negotiate additional merit based assistance. If you're going to request a full scholarship, for example, you should check to see if the school even offers such an amount- and if not, plan accordingly. If they do, how many? If it's, say, 5% of the total class receiving a full ride scholarship, do you think you're in the top 5% of applicants? It never hurts to ask for an amount- no school will rescind your offer simply for politely asking- but it's good to be realistic and plan based on actual numbers.
Conditional Scholarships
What is a conditional scholarship? The ABA defines it as follows:
A conditional scholarship is any financial aid award, the retention of which is dependent upon the student maintaining a minimum grade point average or class standing, other than that ordinarily required to remain in good academic standing.
The ABA does not regulate what the conditions may be, simply that they be clearly disclosed to the student at the time the offer is made. Theoretically, a school could demand that a recipient be the top performing student in their class, though this would be absurd and doesn't happen in real life.
If you are out of compliance with the conditions in your scholarship, then the school has the right to reduce or eliminate your merit aid.
This section of the 509 will provide data on the number of such scholarships offered, and the number of such scholarships lost or reduced by students not in compliance with their conditions.
If a school does not offer conditional scholarships, then this section of the 509 will look like this:

If they do offer conditional scholarships it will look like this:

As you can see the most recent three academic years from that report will be listed- so for a 2019 ABA 509, it will be the 2018-2019, 2017-2018, and 2016-2018 academic years.
In each row two numbers are listed. The Number Entering With is the sum total of students matriculating that academic year with a conditional scholarship. The Number Reduced or Eliminated is the number of those students who, by the end of that academic year, had seen their conditional scholarships reduced or eliminated due to non-compliance with their conditions. Percentages are not provided but are easily calculated; simply dived the number reduced or eliminated by the number entering with and multiply by 100 to see the percentage of students who had their scholarships reduced or eliminated.
Tips on Reading This Section
We suggest being very cautious with conditional scholarships. Law school is already incredibly stressful; now imagine how stressful it would be knowing you have tens or hundreds of thousands of dollars on the line during each exam. Last year 27% of students with a conditional scholarship had it reduced or eliminated. That could easily be you.
All the consultants we asked about conditional scholarships agreed that one of the first things an applicant should do is check the retention rate. As Shannon Davis pointed out, this can be particularly important for applicants who are already coming into the law school with lower than median numbers and may have a harder time staying above the curve or scholarship cutoff.
We have a blog post with more details on how to understand and evaluate a conditional scholarship here. If you're offered such a scholarship we highly recommend reading it.
Academic Attrition

As defined by the ABA, Academic Attrition "refers to those students who discontinued their education at a time when they were not in good academic standing" and "it includes both students who have been dismissed because they did not satisfy the minimum standards of progress established by the Law School in order to continue their legal studies at that school, and students who discontinued their enrollment at the school at a time when their GPA was below that required for good academic standing as of the end of the first year".
Good academic standing will vary from school to school; check with each school to determine what good academic standing is defined as.
This table will be reflective of academic attrition in the year prior to when the report was submitted- so if you want to see academic attrition for prior years, you'll need to change the year of the 509 being generated.
This table is set up identically to the J.D Enrollment table in breaking down attrition by Race and Ethnicity in the rows, and Class Year and Gender Identity in the columns. Refer back to the J.D Enrollment section for a refresher on how to read this table.
Tips on Reading This Section
This section can be very important for students. If there is a high degree of academic attrition we suggest caution. Shannon Davis says "attrition can tell you if a school is letting people in who are at-risk and are having trouble succeeding." It can also indicate that there are particularly onerous academic requirements.
For reference, 110 ABA accredited schools have academic attrition rates of less than 2% in their entering 2019 class, and the median academic attrition rate among all ABA schools for the entering 2019 class was 1.5%. Hopefully those numbers help put higher rates in context.
Other Attrition

This category is a count of those students in a given year who left the law school for reasons other than academic attrition. It doesn't include students who transferred, students studying at another school temporarily, or those who are in a leave of absence of one year or less. We don't see much aid for applicants in this category unfortunately, simply because it's impossible to know why students left- and the numbers tend to be quite small.
Transfers

This category provides information on students transferring into and out of a given law school in the academic year selected. As a general note, we highly recommend students never matriculate to a school with the intention of transferring- because transfers are so dependent on law school grades, relying on transferring is a fools errand. Don't attend any school you wouldn't be happy graduating from.
JD1 Transfers Out is the sum total of students transferring out of the law school after their 1L year. Almost every law school sees a certain number of transfers; so a small number of transfers out is not at all alarming.
Transfers In is the count of students transferring into the law school. Again, most schools see a certain number of incoming transfers.
The following GPA numbers are only reported if the law school had 12 or more transfers in- if between 5 and 12 transfers then the median GPA is the only required report; if less than 5 transfers in there is no reporting requirement for GPA.
75th Percentile JD1 GPA is the 1L GPA for incoming transfers at which 75% of incoming transfers are below.
50th Percentile JD1 GPA is the 1L GPA for incoming transfers at which 50% of incoming transfers are below.
25th Percentile JD1 GPA is the 1L GPA for incoming transfers at which 25% of incoming transfers are below.
Tips on Reading This Section
Joe Pollak points out that if a school sees a significantly high number of transfers out (remember to determine "high" by ratio of transfers to class size) then it could be a sign students are dissatisfied with some aspect of their experience or opportunities at the school. A high degree of transfers out can also be disruptive to the school community.
Conversely, a large ratio of incoming transfers to class size could be concerning, as it can cause increased competition for job opportunities. It can also mean new students who aren't necessarily connected to the school community, which is something many applicants say is important to them.
We have some additional blog posts about transferring here.
Generating Macro Level Data

If you're a numbers nerd, the ABA is happy to help you out. All ABA 509 data is available in Excel format. You can export files that will contain the data for that year for every ABA school in the given category: The Basics/Academic Calendar, First Year Class, Curricular Offerings, Faculty Resources, J.D. Enrollment and Ethnicity, Grants and Scholarships, Tuition and Fees/Living Expenses/Conditional Scholarships, Attrition, and Transfers.
Simply select the year, select the category you're interested, and click generate to export the Excel file!
Conclusion
If you're an applicant, the ABA 509 is your friend. Information is power and the 509 contains so much relevant data. Spend time looking at the information for schools you plan to apply to or are interested in. You won't regret it.
And remember, the ABA has more information than what's on the 509. Employment Outcomes and Bar Passage Outcomes are critically important when selecting a school. Once you're done with the 509's, jump over to those and take a look!