

.png)
The 2019-2020 application cycle has concluded, and we have our final applicant volume as reported by LSAC. We also, for the first time, have data about the composition of the GRE applicant pool. We'd like to thank both the Law School Admission Council (LSAC) and Educational Testing Service (ETS) for making this data available.
Before we get into examining the data, we'd like to clarify some differences between our data and LSAC's that frequently come up. The way that LSAC reports data is reflective of the "high-score" policy. If an individual applies with a 163 in September, they will be included in the 160-164 LSAT applicant category. If they then retake the LSAT in November and score a 168, they will be "bumped" to the 165-169 LSAT category and removed from the 160-164 category. This can cause interesting effects. The most notable of these is that prior-year data is reflective of re-applicants who retook the test and scored higher. So, for example, the LSAC reported data lists the 2018-2019 cycle as having had 604 total 175+ applicants. In contrast, we recorded a final 175+ volume of 564. This is due to the fact that there were 40 or so individuals who applied in the prior application cycle who had scored below a 175+ who re-applied in 2018-2019, retook the LSAT, and scored well enough to now be counted in the 175+ category. Essentially, prior year data is not "frozen," or at least not for the year immediately following it. This means that the LSAC data, as they report it, somewhat overstates the applicant volume in certain LSAT ranges.
Further, LSAC data does not make a distinction for people who applied without an LSAT and then, either later in the cycle or in a subsequent application cycle, took an LSAT. Those individuals will be recorded as if they always had an LSAT score. This means that LSAC underestimates the number of people who applied earlier or in a prior cycle without an LSAT score.
Because we record LSAC data on a daily basis as it is reported, our numbers do not reflect this cumulative "correcting" to the highest reported LSAT score. So for comparing volume on, say, October 15, we will be able to reflect numbers as they actually were on October 15, without the changes later induced by individuals who retook the LSAT in November, January, February, May, June, or July.
Alright, enough of that. On to the data. The numbers show that the 2019-2020 cycle was a very slight increase from 2018-2019, in terms of total number of applicants and applications.

LSAT Applicants
The improvement in applicants and applications was not quite matched by the number of LSAT applicants. First, let's talk about the number of LSATs administered, since that is obviously the key driver behind LSAT applicant volume (and applicant volume generally).
LSAT's Administered
Directly comparing the number of LSATs taken this year and last is difficult. The traditional measure is a June-June measurement, June serving as the "starting point" of a new cycle's LSAT administrations. However, the COVID-19 pandemic resulted in LSAC being forced to cancel the March and April 2020 LSATs. While this was obviously the right thing to do, it shifted many potential 2019-2020 applicants from those tests to "Flex" tests administered in May, June, and July. Usually tests in that part of the year see relatively few individuals using them for applications to start that same fall semester, but as we'll discuss later, there appear to have been more such individuals doing so this year.

Even with LSAC being able to offer a May test in lieu of the planned March and April exams, there were fewer LSATs administered in the 2019-2020 cycle compared to 2018-2019 (though not many—the difference wasn't particularly significant). And it would likely be closer to even (though probably still down) had March and April 2020 been able to proceed as usual.
It is worth noting that the share of first-time test-takers continued to trend down for each administration compared to its prior cycle counterpart.

This is something we've been seeing for years, as more and more applicants become aware of the benefits of a high LSAT score and that schools very much care about that highest score. Retakes, naturally, increase in such conditions. It also seems that candidates are taking advantage of LSAC's expanded testing schedule, which gives them more opportunities to retake the test within one application cycle. It's also likely that this year's retaker ratio was inflated by July 2019 (the free retake if you cancel your score offer).
It does not appear that LSAC's new rule limiting retakes has had any noticeable effect, which isn't surprising given LSAC indicated that for the past few years a very small number of test-takers would have been impacted by the rule.
LSAT Applicant Volume Over Time
It actually seems that the number of LSAT applicants should be down more than it is, when you consider the decline in LSATs being administered. But for quite a while in the first half of the cycle, the number of LSAT applicants was running pretty close to last year—and above it at points.

The 2019-2020 cycle started off with significant applicant numbers—we spent the month of September hovering between 10% and 30% more LSAT applicants than 2018-2019. If you were to go by just the chart showing the number of LSATs administered, this would seem to make sense. While June 2019 was smaller than June 2018, the July 2019 LSAT was double the size of the July 2018 test, and overall there were about 5,000 more test-takers over June-July 2019 than the prior cycle.
However those numbers are deceptive. Many will recall that the July 2019 LSAT came with a special offer from LSAC. Because the test was being switched from a pencil-and-paper format to a digital format, LSAC offered those individuals who took the July 2019 test the opportunity to see their test results first, then decide if they wanted to cancel the score. If they chose to cancel, they would receive the opportunity to retake the test for free any time between October 2019 and April 2020. Approximately half of the July 2019 test-takers took advantage of this offer and cancelled their LSAT scores, which is substantially higher than the normal 4%-6% who cancel. July 2019 numbers do not, therefore, account for the early surge in applicants, since in effect the number of "usable" scores coming out of that test was quite close to the July 2018 administration.
A likelier explanation is a combination of two factors: first, we're talking about pretty small numbers. By September 30, 2019, there were only 4,400 LSAT applicants. At these volumes, even very small changes in actual numbers could lead to misleadingly large percentage shifts. Second, an anecdotal trend we have observed is that re-applying is becoming increasingly popular among applicants who feel they underperformed. These individuals tend to be prepared to submit quite quickly when a new cycle begins, since much of their material is already prepared and they are usually only waiting on a new LSAT score (and they tend to retake during the summer). If there are more re-applicants, it stands to reason that there would be more early applicants.
What's interesting about the early 2019-2020 surge in LSAT applicants is that it does not appear to have been the result of one or a few particular score bands applying earlier. We'll show cumulative daily applicants for each score band later that will reflect this.
The rest of the October-February period was relatively stable. The 7-day moving average for the difference between this year and last stayed between -8% and +12%. Considering how different LSAT-taker volume was for tests in that period that's notable. There are usually quick, tremendous surges in LSAT applicants immediately following a test administration, and so to see that the differences between this year and last remained so relatively close is interesting.
It wasn't until late February that the 2019-2020 cycle fell consistently behind the last two. COVID-19 had not yet had an impact on the cycle (there had been no cancelled tests to that point). From March 1 through April 15, the 7-day average LSAT applicant volume ranged between -3% and -5% — at no point in this time period were there more applicants than the prior cycle. Those dates were before 2018-2019 volume began to be impacted by the March 2019 LSAT test-takers joining the applicant pool, and so we feel is a fair range to compare. If anything, the range is over-generous to the 2019-2020 cycle, considering that in early April LSAC began to offer to resurrect cancelled scores for individuals who had been registered for March and April 2020. At the time it did not look like the then-planned March and April LSAT administrations were going to significantly outpace, or possibly even match, the March 2019 administration, and so it did not seem like there would be a supply of test-takers to provide a late "surge."
It's possible that between late March and mid April applicant volume was depressed by individuals impacted by COVID-19 being unable to apply due to life circumstances. However, we feel that this is unlikely to be a significant factor. For one thing, much of the country was under a state of partial or complete lockdown; many applicants were no longer working, or were working primarily from home, meaning that they would have no less time than normal to prepare an application. For another, the decline had already been present before COVID-19 began to seriously impact the United States. It's possible that economic challenges impacted applicants' ability to submit; however, were that the case, we might expect to see the number of applications per applicant decline at a greater rate than last year in this period, as applicants would be choosier about how they spend their money, and that did not occur.
The trend toward a very modest decline, year over year, seems to have been quite real before the pandemic. This means that it is possible that without COVID-19 we may have seen entirely different LSAT applicant volume in the back third of the cycle. There is no way to know for certain, because we can't go back in time, erase COVID-19, and see what happens.
What actually happened was quite chaotic. LSAC cancelled the March and April testing dates and moved those candidates to the May Flex administration (some candidates were, by their own request, moved to June's administration). Both May and June were very small test administrations — with 9,498 and 8,225 test-takers respectively — and the June 2020 administration was actually only half the size of June 2019 (May has no direct comparison).
As you can see in the graph, once the results for the May test were released (in early June), LSAT volume began trending remarkably upward. Between June 15 and today, 35 out of 52 days (67%) saw an increase in daily applicant volume compared to 2018-2019. There was an average of 31 more LSAT applicants per day over this period than last year.
By late June, the 2019-2020 LSAT volume had actually surpassed 2017-2018 LSAT volume, and was only about 3.5% behind 2018-2019 cycle volume. By July 7, a week after June 2020 scores were released, 2019-2020 LSAT volume was only 2% behind 2018-2019, and continuing to trend upward. There were only 7 days in July where 2018-2019 volume outpaced 2019-2020 volume.
That brings us to now. We've ended the application cycle with an ever so slight decline in LSAT applicants, a difference of 199 applicants.
LSAT Applicant Volume by Score Range
Here we'll take a look at the applicant volume in each LSAT score range. First here's a table showing the absolute numbers and percent change in each score band:

And below we'll break down each score band and how it evolved during the cycle.
175+ Range

The 2019-2020 cycle ended with a 22.3% increase in 175+ applicants from 2018-2019 and a 1.5% decline from 2017-2018.
The 2019-2020 cycle started with growth in the 175+ range, and that did not let up for the duration of the cycle. For a while it looked like the 2019-2020 cycle might even pass the 2017-2018 cycle, which had notoriously high 175+ applicant volume. However, substantial 175+ applicant volume in November-January of the 2017-2018 cycle eventually built up a lead this year could not surpass.
What's interesting about the 2019-2020 cycle is that we had notably more late cycle applicants than prior years, even in this highest score range where applicants tend to apply earlier. This year, 9% of 175+ applicants applied after March 1; in 2018-2019 it was less than 5%, and in 2017-2018 it was less than 3%. 75% of the late surge came from applicants taking the June and July tests who had already submitted an application and either had not taken an LSAT yet, or re-took the test and had a new high score in the 175+ range; they account for about 7% of the final applicant volume in this score range. It's very unusual to see such significant jumps in high-scoring test-takers this late — you can see that in the chart above, where the June jump especially pops out. Compare that to the impact of the June 2019 test — it had twice as many test-takers, about the same ratio of re-takers, and yet it saw only 20% of the subsequent jump in 175+ scorers immediately following score release as did the June 2020 exam.
Those folks are interesting to ask about. What caused so many clearly well prepared individuals to retake the test? Perhaps the increased competition in the high LSAT score range schools this year resulted in more individuals seeking to retake for an improved score that could help their chances on the waitlist. Or maybe the individuals who applied this year and decided, in light of the probable disruption to the fall (and potentially spring) semesters due to COVID-19, to reapply next cycle. Either of these would suggest that there's probably a reserve of especially high scoring applicants ready to submit early in the 2020-2021 cycle. However, applicants shouldn't panic too much yet. This range is extremely volatile — and at the end of the day we're talking about a pretty small number of people.
170-174 Range

The 2019-2020 cycle has concluded with a 9.5% increase in 170-174 applicants compared to 2018-2019 and a 8.5% increase compared to 2017-2018.
Similarly to the 175+ range, it's interesting just how much late cycle volume there was in this group. As of March 1, over 7% of the final volume in this category hadn't yet been received, compared to 5% and 3% for 2018-2019 and 2019-2020 respectively. The June and July LSAT exams obviously played a role, with clear jumps from individuals taking those tests clear in the data. The late (post-March 1) surge accounts for about a third of the total difference in applicant volume in this range compared to 2018-2019. If the post-March numbers had been identical this year as last, there would still be an overall increase in 170-174 applicants, but a more modest 6.3% instead of 9.5%.
165-169 Range

The "star" of the 2019-2020 cycle was the 165-169 applicant range, showing an 11.6% increase in 165-169 applicants over both 2018-2019 and 2017-2018 (funnily enough, both those years ended with identical volume in this category). That translates to an extra 603 applicants this year falling in this range — which, if you're a law school with medians typically in this range, is great news. Less so if you were an applicant.
We suspect that increased competition in this range was partially responsible for the late surge in the 170+ range; applicants who applied with a 165-169 may have seen results that did not match their expectations due to schools being able to be more selective this year thanks to the volume growth. Some of these applicants likely chose to retake the LSAT in hopes that a better score would yield the admissions or scholarship results they wanted.
Once again, there was substantial growth in this category late in the cycle (late for the typical applicant in this range, anyway), though it was proportionally less than the 170-174 and 175+ ranges. Nearly 9% of final 165-169 applicant volume came after March 1, compared to about 6% and 5% in 2018-2019 and 2017-2018 respectively. In fact, there were over 50% more applicants in this timeframe than in 2018-2019.
160-164 Range

This is the first LSAT score range with a decline in applicants compared to 2018-2019. There were 2.2% fewer such applicants this year than last; however the number was up by 1.1% compared to 2017-2018. In raw numbers the decline wasn't huge, 191 applicants in total.
Much like every score range before it, there was a late surge in applicants within this range. From March 1 on, there were 29% more applicants in this range than last year, which helped close the gap from a 6.1% decline that was present at that point. If in that latter part of the application cycle there had been the same number of 160-164 applicants as last year, the final tally would have shown a 5.5% decline year-over-year.
155-159 Range
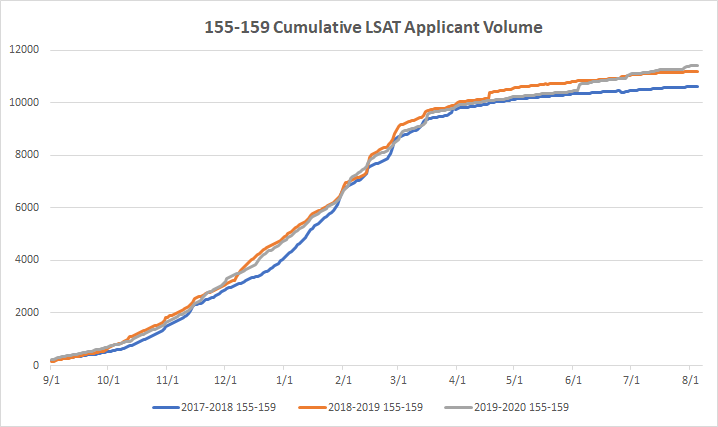
Here we return to the trend of increases in applicant volume. The 155-159 range ended with a 2% increase over 2018-2019, and a 7.5% increase over 2018-2019.
This score range is a great demonstration of how important the switch to an online Flex LSAT format was for law schools and applicants. A significant number of applicants in this range last year used the March and June tests for Fall 2019 applications. This year, the March and April tests were cancelled due to COVID-19, and by April 19 (the day after when last year's March scores were released), there was a 3% decline in applicants in this range. That decline held steady until LSAC released the results of the May 2020 Flex exam. Within 2 weeks of score release, the gap had narrowed to a mere 30 applicants; the release of June 2020 scores saw the 2019-2020 cycle exceed the 2020-2021 cycle's volume and continue to grow to the final plus 2%.
150-154 Range

The 2019-2020 cycle ended with an extremely slight decline in 150-154 applicants, 0.4% fewer. This is still almost 4% more than the 2017-2018 cycle, however.
Once again, the option for an online LSAT made a significant impact here. The cancellation of the March and April LSATs this year were immediately noticeable in the volume. By April 19 (the day after when last year's March scores released), the decline in 150-154 applicants was 6.3%. That number held steady until the release of May 2020 Flex results, but within 2 weeks of score release, the decrease had been halved. June 2020 further closed the gap, and by July 15 there were only 174 total applicants separating the 2019-2020 cycle and the prior cycle.
145-149 Range

If the highest three scoring ranges tell a story of applicant growth, the lowest three scoring ranges tell the opposite tale. Final volume in the 145-149 category was down by 6.2% compared to 2018-2019, and down 4.2% compared to 2017-2018.
There was a late surge in applicants in this range that can be largely explained by simple lack of available tests, i.e. the cancelled March and April exams. Applicants in this range tend to apply later. In 2018-2019 this range did not reach 80% submission until the release of the March 2019 scores in mid-April. Immediately before that point this year, the two cycles were running close in terms of the percentage of final applicant volume submitted: 76.5% for 2019-2020 and 79.4% for 2018-2019, a fairly small difference.
However, the difference was significant for the final volume outcome. Before May Flex scores were released, this range had decreased by 14.1% compared to 2018-2019. After those scores came out, applications picked up immensely, with an average of over 5 additional applicants per day until immediately before July 2020 results when compared to 2018-2019. That might not sound like a lot, but it was a 40% increase, and narrowed the gap in the number of applicants by about 25% over that same period. Further narrowing happened after the July score release, which saw over 5 times the number of applicants join the pool from score release to cycle's end compared to the prior year. It's hard to know whether there would have been similar volume increases after last year's July exam, since results were not posted until the cycle had been finished for a few weeks.
140-144 Range

This is another low score range with substantial decline year-over-year. There were 5.3% fewer such applicants in this range for the 2019-2020 cycle than the 2018-2019, and 2.7% fewer than 2017-2018.
The 140-144 range is one of the only ranges where there was not a "September Surge" in applicants. In fact, by September 14, there was already a 4% decline in 140-144 applicants, and there would be no point in the cycle where volume would exceed the 2018-2019 cycle. It's possible that this is a result of the July 2019 LSAT's special offer. We imagine that it was quite common for applicants who scored 140-144 on that test to cancel their results. We do know that, of those July 2019 test-takers who had not yet taken another test by early April 2020, 41% had scored in the "lowest-quartile" on the July 2019 test, so there is some evidence to support the belief that very low scores were likelier to cancel. That could easily have reduced the supply of available 140-144 scorers.
Applicant volume in this range — which in 2018-2019 did not exceed 80% of its final cycle volume until late April — does not seem to have been particularly hurt by the cancellation of March and April's LSAT administrations. The total decline in applicants over the period of late April to early June (which would be the period most impacted by the loss of those LSATs) only grew by 30 total applicants.
The Flex tests increased volume, of course. Between the release of the May 2020 results and immediately before the release of July 2020, the decline in this range lessened by 25%.
<140 Range

The lowest score range tracked by LSAC saw a decline of 5.1% for the 2019-2020 cycle compared to 2018-2019, and 5.6% compared to 2017-2018.
This score range actually recovered substantially throughout the year. At the end of September there had been a 33% decline in applicants in this range, similar to the 140-144 range; this makes sense when you consider who was likeliest to cancel July 2019 scores.
Slowly over the course of the cycle, volume got closer to 2018-2019. This increased particularly accelerated after LSAC pivoted to the online Flex exam. Within 2 weeks of the first Flex results being released, the decline had gone from -17% to -11%.
LSAT Applicant Volume by Score Band – Percent of Total
Here's a look at how much of the total LSAT applicant pool was made up of each LSAT score band:

You can also see the difference in the composition of the LSAT applicant pool compared to 2018-2019:

The largest difference came in the 164-169 score band, which increased its share of the total pool by 1%. That may not sound like a lot, but it's really quite a bit — especially considering how high on the scoring scale it is.
Late Surge
It seems clear there was a late surge in applicants, but how much of that was due to the fact that the July 2020 test was much earlier than the July 2019 test, and so data from this year's July results reflects in volume and last years does not? To check that, we cut off the data on July 25, a few days before the release of July 2020 results, and so before they could have a significant impact. We also started measuring from April 1, when COVID-19 had really started to significantly impact the world (and hence, potentially applicant volume). The numbers below show the difference in cumulative applicants in that range compared to the same time period in 2018-2019.

The numbers are pretty clear. With or without July's test, there was a surge in the back third of the application cycle. Excepting the <140 range, that surge was strongest in the higher LSAT bands.
LSAT Applicant Timing By Score Range
It's always interesting to look at how early applications are coming in for each score range. Why would applicants care about this? Because generally, you're competing against people in your similar LSAT range. This sort of data can show you when they're submitting- and give you an idea of what "early" "on time" and "late" would be for your given range.
Here's a look at the tables reflecting the percentage of final applicant volume in each range on the last day of each month — 2019-2020 and 2018-2019 are both included.


Now here's a comparison highlighting whether the percentage of final volume was greater than, less than, or equal to the same date in 2018-2019 for 2019-2020.

As you can see, by the end of November 2019, the 160+ score ranges each had noticeably more of their final volume submitted. That continued to be the case for several of them through December. It seems that we were on track for more of our final applicant pool, in those ranges, submitting early (remember, there's an October LSAT now). In late February 2020, that changed, and we saw less and less of our final applicant pool in on a given date from then forward.
Given the changes in LSAT administration, we wouldn't read too much into the end-of-November jumps. High scoring applicants may be applying very, very slightly earlier, but without the test date changes and COVID-19, the results would probably have been insignificantly different from 2018-2019.
Non-LSAT Applicants
Non-LSAT applicants play an increasingly important part in law school admissions and volume, driven primarily by the GRE. The GRE is currently accepted by 60 ABA accredited institutions, and that number keeps going up. That's quite a lot of growth since first being accepted by the University of Arizona in February of 2016. Per ABA regulation, individual schools must continue to demonstrate to the ABA that the GRE is a valid and reliable test for admissions purposes (as opposed to the LSAT, which is accepted by the ABA by default). This has certainly slowed the pace of GRE adoption by schools.
In spite of all that, non-LSAT applicants (who are, again, primarily GRE test-takers) were up substantially this year compared to 2018-2019.

In fact, if there were the same number of non-LSAT applicants as last year, the overall number of people who applied to law school this year would be down. The increase in non-LSAT applicants is responsible for the overall increase in law school applicants.
GRE Specifics
For the first time, we have access to GRE-specific data, thanks to ETS. Here we can first see the total number of individuals who submitted a GRE score to a law school:

The number jumped substantially from 2017-2018 to 2018-2019 but rose more modestly for 2019-2020, which makes sense — the number of schools accepting a GRE score jumped dramatically from 2017-2018 to 2018-2019. It continued to grow for 2019-2020, just not quite at the same pace.
As you can see, our number of GRE applicants (measured by those individuals sending GRE scores to law schools) exceeds the total number of non-LSAT applicants as tracked by LSAC. This is probably a result of three factors:
- First, individuals who had a GRE score when they applied but then, for whatever reason, chose to take an LSAT at a later date. Those individuals would then be counted by LSAC (and the ABA) as LSAT applicants, and would be removed from the count of non-LSAT applicants.
- Second, some individuals may have taken both the GRE and the LSAT before applying, but submitted both scores to law schools, either by choice or by school requirement. These would, again, be counted as LSAT applicants only by LSAC.
- And finally, some schools have programs not requiring any test score. Those are folks without a GRE or LSAT, and are counted by LSAC as non-LSAT applicants.
The topline GRE applicant numbers tend to support the idea that the increases we've seen in non-LSAT applicants are primarily due to individuals using a GRE score.
We also have specific data on the composition of the GRE applicant pool (this data reflects the highest score for a fair comparison to the LSAT data, which also reflects highest score).


Law school applicants who submit the GRE tend to have very strong Verbal Reasoning and Analytical Writing scores. Over 50% of test submitters scored above a 157 on the Verbal Reasoning section, which is the 75th percentile of test-takers. That's the rough equivalent of scoring above a 158-159 on the LSAT. GRE law school applicants also perform very well on Analytical Writing, with a majority scoring at or above a 4.5, the 80th percentile.
Unsurprisingly GRE applicants to law school do less well on Quantitative Reasoning. Over 58% score below the 62nd percentile (157). When you consider that the GRE is taken by applicants to math-intensive graduate programs, this makes a good deal of sense.
If GRE applicants were required to only submit Verbal and Writing scores, we'd actually see a higher scoring population of GRE applicants (measured by percentile on their respective test) than LSAT applicants. Of course, that's not actually the case; schools have to consider Quantitative scores. And despite what you may have heard, there is actually some math at law school. However, it's definitely interesting, and we'd be curious to see how the tests compared if the LSAT was broken down into its constituent parts for scoring (and imagine a world where LSAT Writing was actually scored!)
We've talked about how these sub-section results play into the U.S. News rankings. As long as the rankings are around they will have an impact on admissions processes, for better or worse.
Application Volume
Applications to law school are distinct from LSAT applicants and non-LSAT applicants, though they are obviously influenced by both of those things. Anyone who applies to law school is just one applicant. But, applicants can submit as many applications as there are law schools.
The 2019-2020 application cycle has ended with applications up by 0.41% compared to 2018-2019 and down by 1.09% compared to 2017-2018.

Schools also, on average, tended to do about as well this year as last.

Just over half of law schools had an increase in applications — though as you can see from the chart, about two-thirds of all schools were clustered in the +/-9% range.
The story with applications is, unsurprisingly, largely similar to that of LSAT applicants and non-LSAT applicants. The cycle started off with significant application increases, between 15% and 30% through September. That difference then moderated, and for the next several months until late February stayed close to 2018-2019 numbers. After February there was a consistent decrease compared to 2018-2019, which didn't begin to disappear until about a week before the May Flex results were released, as individuals began submitting applications in anticipation of receiving their scores. Since then, 55 out of 65 days have seen more applications this year compared to last.
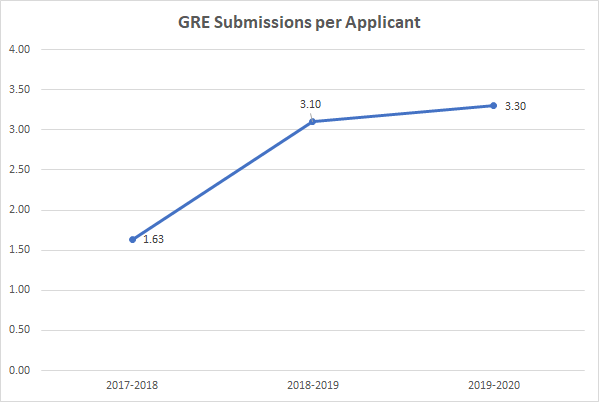
Despite the increase in overall applications submitted, the number of applications per applicant (the average) has decreased.

The decrease for 2019-2020 is small, and can easily be attributed to randomness. However, the decrease from 2017-2018 to both 2018-2019 and 2019-2020 is very noticeable. If the 2019-2020 application cycle had seen the same number of applications per applicant as that year, there would have been an additional 21,000 or so applications submitted.
In fact, 2019-2020 is a continuation of the past decades declining trend in applications per applicant.

There was a general decrease following the implosion of the law school applicant market, but a brief recovery after the 2015-2016 cycle. However, it seems that last year's drop wasn't a one-off.
We've speculated in the past on a few potential causes for the decrease here. For one thing, LSAC school report fees have risen far faster than inflation. In March of 2015, school report fees were $28 each; they are $45 now. That's a 60% increase. Contrast that with CAS and LSAT registration fees, which have risen a still-high 18% each. An applicant today would be spending an extra $102 to submit the same average 6 applications today than they would have submitting those same applications in 2015-2016. Add in the increases in LSAT and CAS fees, and it may be that applicants are simply running up against financial constraints. It's also possible — though we don't have any data on this — that schools have responded to the general increase in applicants and applications by being more selective with the fee waivers they hand out. This doesn't seem quite as likely; anecdotally they still seem to be given out quite liberally.
It's also possible applicants are choosing to be more selective with where they apply for non-financial reasons. Perhaps applicants are increasingly aware of "predictor" tools which use prior cycle data to give applicants an idea of how likely they are to be admitted at a certain school, and thus feel more confident in their selection of schools. This seems unlikely, however. An increase in applicants has resulted in cycles becoming increasingly competitive. This is a widely known fact. In a more competitive cycle you would expect applicants to cast a wider net, to ensure they maximize their chances of a preferred outcome.
Whatever the reason, it's something worth keeping an eye on if you're LSAC or a law school. Fewer applications per applicant give schools less cushion if the number of applicants were to decline.
Also worth noting is the number of schools GRE applicants submitted their scores to — a rough proxy for applications per applicant in that category.
GRE applicants submitted about half the number of applications as the overall applicant pool did. This isn't surprising for a few reasons. First, GRE applicants have a smaller pool of schools to choose from. As a natural result, they will submit fewer applications. Second, the GRE is often used by applicants looking for dual-degree programs. Such programs have much more limited availability than regular J.D. programs, and so again, GRE applicants have a smaller pool to select from.
Still, the proportion of GRE applicants submitting multiple applications has grown every year, from 33.3% to 54.7% to 56.4%. As more and more schools accept the GRE we expect the applications-per-applicant gap to narrow.
Conclusion
2019-2020 was another year of increase in the law school applicant and application pool. The extremely marginal decline in LSAT applicants was more than made up for by growth in non-LSAT applicants, driven by growing adoption of the GRE. It was also, like everything else in 2020, impacted by the COVID-19 situation. Law schools and applicants are fortunate that LSAC and ETS were able to rapidly pivot towards online administration of their testing programs – although there were some early glitches on the testing end. Still, if they hadn't, or had been slower, we'd be looking at very different numbers right now.
It'll be interesting to see how these changes are reflected in the incoming class. Top schools generally had an applicant pool with more high scorers, but the middle ranges weren't significantly changed one way or another. There's also the question of how COVID-19 influenced things — deferrals, changes in class size to accommodate online learning, etc. Those who are interested can check out the changes we're tracking here.


